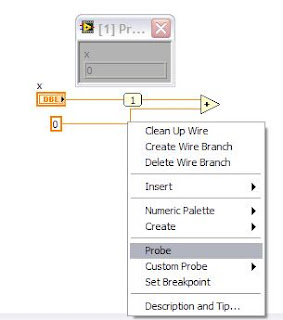
Last week I pointed out how cool 'Highlight Execution' is:
http://blog.irodata.com/2011/01/highlight-execution.html
This week I am happy to say that it gets even better:
http://decibel.ni.com/content/docs/DOC-1695
There are many concepts covered in this tutorial that are what one would expect (e.g. breakpoints, single stepping, and suspending execution). The item that really got my attention though was the probe tool. Despite the name (seriously NI, couldn't you name the thing the 'Data Inspector' or something?), this is a very cool tool. The ability to watch data move through a VI and to be able to see the value of the data on the wire is pretty slick.
The following is all directly from the tutorial referenced above:
Use the Probe tool, shown as follows, to check intermediate values on a wire as a VI runs.
Take advantage of the Probe tool if you have a complicated block diagram with a series of operations, any one of which might return incorrect data. Use the Probe tool with execution highlighting, single stepping, and breakpoints to determine if and where data is incorrect. If data is available, the probe immediately updates during single stepping or when you pause at a breakpoint. When execution pauses at a node because of single stepping or a breakpoint, you also can probe the wire that just executed to see the value that flowed through that wire.

